





Time
Cost
Validity
In this project COSA collaborated with JNP Coffee, a specialty coffee importing company working directly with smallholder farmers in Burundi. With a genuine commitment to improving farmer livelihoods, including specific partnerships with women’s cooperatives through the International Women’s Coffee Alliance (IWCA) local chapter, JNP has been working to build a stronger evidence base for its operations and to honor its commitments to prominent buyers such as Nestle around living income standards. COSA assisted JNP to map its farmers with reliable, and timely data. Farmers, buyers, cooperatives, and policymakers alike lack access to accurate information on what it costs to produce coffee, how much income farmers earn from it, and how their overall economic situation evolves throughout the year. Without reliable cost and income data, buyers cannot set prices that reflect the economic realities of production, cooperatives cannot design targeted support programs, and farmers themselves cannot understand or optimize their own financial position. Beyond generating this evidence, the project was designed to test a fundamental question: can mobile technology replace or meaningfully complement traditional enumerator-based surveys in low-income, low-connectivity, low-literacy settings?

Building on prior successful work in Rwanda, where COSA collaborated with ICO, GIZ, and NAEB to develop a survey to assess cost of production and actual income for coffee farmers, COSA proposed applying a similar but more technology-driven approach in Burundi. Supported by the Gates Foundation through the ADAIM initiative, this project represents the first comprehensive assessment of cost of production and actual income for coffee farmers in Burundi supplying JNP Coffee.

The sample was randomly selected from a list of 1,500 farmers provided by JNP Coffee. Those 1,500 farmers were selected proportionally to the different provinces and the gender of the farmers. The sample accounted for both educated and uneducated household heads with at least one member in the household able to read and write.
The sample was originally composed of 400 farmers, with 309 male and 91 female farmers. However, 3 farmers passed away, 2 did not participate in the study, 2 lost their phones, and 1 never participated in the activity module, resulting in a final sample of 394 farmers. Among these, 304 are male and 90 are female farmers. Of the 394 farmers in the final sample, 383 participated in the in-person survey, representing a response rate of 97%, of whom 293 are male and 90 are female.

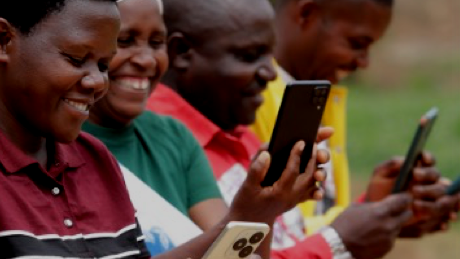
COSA deployed the AgileAg App, a mobile platform for real-time, farmer-reported data collection, alongside a traditional in-person survey and Coffee Washing Station (CWS) coffee sales administrative records. The AgileAg App collected high-frequency real-time data throughout the full coffee production cycle, from planting through harvesting and selling (October 2024-July 2025). The App was built with the specific constraints of the Burundian context in mind: very low literacy levels, intermittent internet connectivity, and limited prior exposure to digital tools. A central component of the project was what COSA calls data democracy: the systematic sharing of useful information back to farmers based on their own inputs. Farmers received notifications when their coffee production costs exceeded recommended benchmarks, along with agronomic insights tailored to their reported activities. This reciprocal exchange was intended both to incentivize ongoing participation and to create genuine value for farmers beyond the research objectives of the project.The App was deployed alongside two other data sources: a traditional in-person survey conducted by trained enumerators, and administrative records from Coffee Washing Stations (CWS), which track every delivery made by every farmer throughout the season. This three-source design allowed the project to assess how the App’s data quality compares to established alternatives.